Wearable health devices have transformed how we monitor health by providing continuous data on metrics like heart rate, blood oxygen, and posture. However, interpreting this data effectively requires a structured approach to avoid errors and improve patient outcomes. Here’s a quick breakdown:
- Verify Device Accuracy: Ensure the device is genuine, calibrated, and updated to avoid unreliable data.
- Assess Data Quality: Check for signal consistency, gaps in monitoring, and cross-validate data across devices.
- Interpret Health Metrics: Focus on trends in heart rate, HRV, SpO2, and posture patterns to identify potential health risks.
- Integrate Clinical Records: Combine wearable data with medical history and use AI tools for deeper insights.
- Validate and Act: Confirm findings with diagnostic tools and create actionable care plans tailored to individual baselines.
Wearable data is only valuable when it’s accurate, contextualized, and used alongside clinical expertise. This checklist helps ensure that the insights drawn are reliable and actionable.
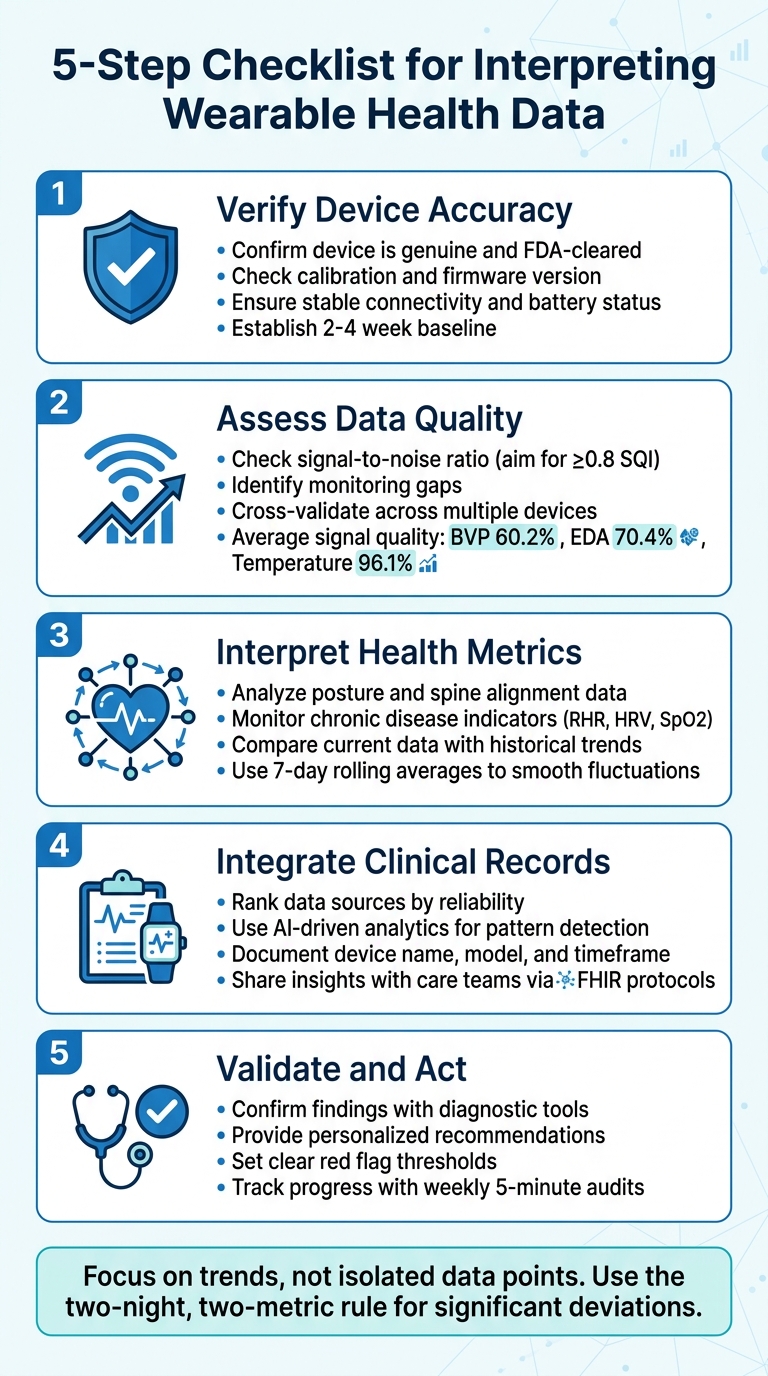
5-Step Checklist for Interpreting Wearable Health Data
Heart Rate Variability Devices Demystified: Wearable Data for Better Health & Performance
sbb-itb-44aa802
Check Device Authenticity and Calibration
Before diving into wearable data, it’s crucial to ensure the device is reliable. Wearables come in two main categories: those with FDA clearance for clinical use and those marketed as general wellness devices for everyday consumers. This distinction matters because prescription-grade devices undergo rigorous validation, while wellness devices may not meet the same standards.
Confirm the Device Is Genuine
Start by verifying that the device is genuine and sourced directly from the manufacturer or its authorized distributors. This step helps avoid counterfeit products or tampered hardware. For example, devices like AIH LLC‘s aiSpine posture monitor or aiRing vital signs ring should be registered through the AIH Health App and linked to the manufacturer’s platform. This process ensures you’re working with legitimate hardware that meets quality requirements.
Additionally, check if the device aligns with industry technical standards, such as IEEE P360 for consumer electronics or CTA standards for specific metrics. Independent validation is also key here. As the INTERLIVE Network highlights:
"The validity assessment of consumer wearables is most optimally performed by independent institutions, but the number of new devices… makes it almost impossible for scientific institutions to keep up".
You’ll also want to confirm intradevice reliability – whether the device consistently produces reproducible data when used by the same person. Finally, make sure the device is calibrated correctly and its firmware is up-to-date to ensure data accuracy.
Check Calibration and Firmware Updates
Firmware updates can have a significant impact on how data is processed. If updates occur mid-treatment, they can disrupt the consistency of your longitudinal data. Paul Burggraf, Co-founder and CSO at Thryve, underscores this point:
"Data trends only make sense when signals are standardized across devices, timeframes, and updates".
To avoid issues, record the device’s initial firmware version via the AIH Health App and check for updates before starting use. In clinical environments, it’s often wise to disable automatic firmware updates during treatment periods to maintain data consistency. Peter Düking, MSc, from the University of Würzburg, adds:
"The nature of the software in the wearable itself, as well as of the software in any accompanying device (ie, laptop, smartphone application) exerts a considerable influence on data quality".
Proper sensor placement is another critical factor. Many sensors require precise positioning to maintain calibration. For instance, electromyography sensors should be placed halfway between the nerve entrance and the myotendinous junction. Similarly, posture monitors like aiSpine must be worn according to the manufacturer’s specifications to prevent signal issues. Once calibrated, check connectivity and battery stability to ensure uninterrupted data collection.
Verify Connectivity and Battery Status
Stable Bluetooth connectivity and adequate battery life are essential for continuous monitoring. Battery life varies widely among devices – some require daily charging, while others can last several days. Short battery life can lead to data gaps, particularly overnight when sleep and recovery metrics are being tracked.
To avoid interruptions, ensure the device is synced properly and that the battery is sufficiently charged. Use the companion app to set up automated sync reminders, reducing the risk of data loss. For devices with shorter battery life, schedule charging during times of low activity rather than overnight to preserve sleep data. Establishing a consistent 2- to 4-week baseline of uninterrupted data is crucial before drawing any clinical insights.
Evaluate Data Quality and Consistency
Once you’ve confirmed that a device is authentic and properly calibrated, the next step is to assess whether the data it records is both reliable and complete. Even the most dependable device can produce flawed data if signal quality is poor or if monitoring is interrupted.
Check Signal Quality
Signal quality is critical to determining whether the data reflects actual physiological activity or just noise. For optical sensors like those used in the aiRing, distinguishing between a genuine heartbeat and motion artifacts is essential. As Research Wearables explains:
"The challenge in PPG research isn’t just measuring the pulse – it’s knowing when that pulse is real".
To ensure accurate readings, aim for a signal-to-noise ratio of at least 0.8 SQI. Cross-check the data with secondary metrics like a 3-axis accelerometer or skin temperature to confirm that features (e.g., the systolic upstroke or dicrotic notch) represent true physiological signals. Erratic or flattened waveforms often point to poor contact or motion artifacts.
A multi-center study found that the average BVP signal quality is around 60.2%, with a spectral entropy threshold of 0.89 being effective at separating true signals from motion-related noise. Additionally, if EDA readings fall below 0.05 μS or skin temperature is outside the 77°F to 104°F range (25°C to 40°C), it’s likely the device isn’t making proper contact with the skin.
Once you’ve confirmed the signal quality, the next focus should be on identifying any interruptions in monitoring.
Identify Gaps in Monitoring
Monitoring gaps are unavoidable – devices may be removed for charging, lose Bluetooth connectivity, or simply not be worn consistently. The challenge lies in differentiating between data completeness (whether data points exist) and signal quality (whether those points are accurate). Continuous data collection is essential for creating a reliable clinical profile, so addressing interruptions is crucial.
Studies show that real-time streaming can lead to significant data loss – up to 49% on average – compared to onboard recording, which reduces loss to about 9%. To pinpoint gaps, calculate the ratio of recorded to expected duration to flag missing data.
Device logs and temperature thresholds can help identify periods when the device was removed or worn incorrectly. Interestingly, signal quality tends to be better at night due to reduced motion, which minimizes artifacts.
Rapid changes in signal amplitude may signal data degradation. For BVP/PPG sensors, applying spectral entropy thresholds can help identify sections of data where motion has compromised heart rate accuracy.
Compare Data Across Multiple Devices
When using multiple AIH devices, such as the aiSpine posture monitor and aiRing vital signs ring, cross-checking data can reveal inconsistencies and device-specific errors. This is especially important if devices are used interchangeably for the same patient. Comparing data across devices helps ensure measurements are consistent and supports better clinical decision-making.
To do this effectively, calculate the coefficient of variation (%CV) and synchronize timestamps to identify overlapping data gaps or discrepancies. For instance, if one device shows high activity while another records no heart rate, it might indicate a motion artifact or poor sensor contact.
Keep in mind that different devices often use proprietary algorithms and data formats, which can make direct comparisons tricky without proper cross-validation. Temperature data tends to be the most reliable across devices, with a signal quality average of 96.1%, followed by EDA at 70.4% and BVP at 60.2%. While consumer wearables are great for identifying long-term trends, they may fall short of medical-grade precision. Comparing multiple devices can help determine whether a recorded change reflects a true physiological trend or a device-specific issue.
Interpret Key Health Metrics
Once you’ve ensured the data is accurate, the next step is interpreting it to uncover actionable clinical insights. This means understanding what each metric reveals about a patient’s health and identifying deviations that could signal potential issues.
Analyze Spine and Posture Data
Start by evaluating posture data collected by devices like the aiSpine, which tracks spinal alignment, movement, and strain risks. This device uses haptic feedback – gentle vibrations – to alert users when they deviate from neutral spinal alignment. The system also logs posture deviations, making it easier to identify patterns of poor posture.
For example, if vibration alerts repeatedly occur between 2:00 PM and 4:00 PM while a patient is working at a desk, this suggests sustained strain. In such cases, ergonomic adjustments or scheduled movement breaks might be necessary to reduce the risk of chronic issues.
However, wearables have their limits. Vincent Luppino, a physical therapist at HSS, explains:
"Current technology is limited in detecting proper mechanics or form".
While these devices can track movement and count repetitions, they often can’t assess whether exercises are performed correctly. If a patient logs activity but continues to experience joint pain or balance problems, it’s a good idea to refer them to a physical therapist for further evaluation.
Monitor Chronic Disease Indicators
Wearable devices like the aiRing track critical metrics for managing chronic conditions, including resting heart rate (RHR), heart rate variability (HRV), respiratory rate, and blood oxygen (SpO2). These metrics provide continuous insights into cardiovascular and autonomic health.
- Resting Heart Rate (RHR): A normal adult RHR ranges from 60 to 100 beats per minute. However, a rise of 5–8 beats above a patient’s baseline could indicate stress or early signs of illness, even if it falls within the "normal" range.
- Heart Rate Variability (HRV): A suppressed HRV combined with an elevated RHR often signals illness or stress before physical symptoms appear.
- Blood Oxygen (SpO2): Normal SpO2 levels range between 95% and 100%. Readings below 95% may require medical attention, and levels under 88% are considered a medical emergency. Drops in SpO2 during sleep, especially when paired with a higher respiratory rate, may suggest sleep apnea.
Real-world examples highlight the value of monitoring these metrics. In 2020, the American College of Cardiology (ACC) partnered with Evidation Health for the "Achievement for Heart Health" program. By May 2021, 474 participants with heart failure had enrolled, with 61% using connected wearables. The program collected data and provided personalized educational resources to improve care. This initiative aimed to address gaps in guideline-directed therapies, which only 30% of patients currently follow.
| Metric | Normal Range | Red Flag Threshold |
|---|---|---|
| Resting Heart Rate | 60–100 BPM | >100 BPM or 5–8 beats above baseline |
| Blood Oxygen (SpO2) | 95%–100% | <95% (concerning); <88% (emergency) |
| Heart Rate Recovery | ≥18 beats at 1 min | Slow recovery despite fitness |
| Daily Steps | ~7,000+ steps | <2,000 steps (sedentary concern) |
Compare Current Data with Historical Trends
While single data points offer a snapshot, trends are what reveal the bigger picture. As Paul Burggraf, Co-founder and Chief Science Officer at Thryve, puts it:
"Health literacy in the wearable era means learning to read trends, not react to noise".
To establish a reliable baseline, collect two to four weeks of consistent data under stable conditions – free from illness, travel, or stress. This baseline helps contextualize new readings and ensures that insights are grounded in the patient’s normal patterns. For metrics like HRV and RHR, using 7-day rolling averages can smooth out natural fluctuations. HRV, for instance, can vary by 20% to 40%, while RHR can shift by 5 to 10 beats per minute nightly.
Follow the two-night, two-metric rule: consider a deviation significant only if it persists for at least two consecutive nights and is confirmed by two metrics trending in the same direction. For example, HRV trending down while RHR trends up over multiple nights could indicate a developing issue. Instead of reacting to a single poor reading, look for three-day clusters of changes to identify patterns.
A weekly 5-minute audit of a 30-day data overview can uncover sustained shifts in metrics like RHR or HRV. Link these changes to possible triggers such as stress, late meals, alcohol use, or increased workload. This process helps differentiate between temporary responses and signs of ongoing strain that may require intervention.
Programs combining AI monitoring with care coordination have shown tangible benefits. For example, chronic care programs leveraging proactive trend analysis have reduced hospital admissions by 10–25%. This demonstrates the power of focusing on trends rather than isolated data points.
Combine Wearable Data with Clinical Information
Wearable data on its own can only tell part of the story. When combined with patient records, lab results, and contextual factors like medications or lifestyle changes, these metrics can become powerful tools for delivering tailored care in real time.
Compare with Patient Medical Records
Not all data sources are equally reliable. It’s important to rank them based on trustworthiness. For example:
- Very High Trust: Hospital-grade monitors and accredited lab results.
- High Trust: Clinic-acquired vital signs.
- Moderate Trust: FDA-cleared medical wearables, such as continuous glucose monitors.
- Low–Moderate Trust: Consumer devices like smartwatches and fitness rings.
- Lowest Trust: Patient recall of health metrics.
When documenting wearable data in the EHR, be specific about the source. For instance, instead of writing, "Patient has AFib", use more cautious language: "Patient reports smartwatch notifications labeled ‘possible AFib’; device is consumer-grade and not diagnostic; 12-lead ECG ordered for confirmation".
Small changes in metrics can signal larger concerns. For example, if a patient’s resting heart rate rises by 8 beats above their baseline, it’s worth checking for potential triggers like late meals, alcohol, travel, or work stress. This helps differentiate between temporary fluctuations and more serious clinical issues.
AI analytics can further refine these observations by identifying meaningful trends.
Use AI-Driven Analytics
AI tools are transforming how wearable data is processed and applied. The AIH Health App, for example, integrates real-time data from devices like the aiSpine and aiRing to provide personalized insights and risk assessments. These systems filter raw data to focus on patterns that matter clinically before integrating it into the EHR.
In a 2025 study, the Mayo Clinic demonstrated how AI could analyze ECGs from Apple Watches to detect asymptomatic left-ventricular dysfunction. Patients securely transmitted the data directly into their EHR via an app. Similarly, the Cleveland Clinic partnered with Masimo on a program that uses AI to monitor patients continuously and send early alerts about potential deterioration.
Slava Khristich, CTO at TATEEDA | GLOBAL, highlights the importance of simplicity in AI notifications:
"Good alerting should feel quiet most of the time. The point is one clear next step with a short explanation that a human can verify in seconds."
AI systems can also predict risks over the next 48–72 hours by analyzing multi-signal trends. For example, a combination of a rising resting heart rate and decreasing heart rate variability over several nights might indicate an emerging health concern that requires attention.
Once AI processes the data, the next step is to share it effectively with the care team.
Document and Share Data with Care Teams
To ensure clarity, summarize key metrics such as glucose time-in-range, average resting heart rate, or posture deviations. Always include details like the device name, model, and the specific time frame reviewed (e.g., 07/01/2026 to 07/14/2026). Specify whether the data influenced your clinical decisions or was used only as background information.
For example, if no issues are found after reviewing a week’s worth of heart rate data, document it clearly: "Reviewed 7 days of resting HR data; no episodes of tachycardia or irregular rhythm reported by device".
Standardized protocols like FHIR (Fast Healthcare Interoperability Resources) make it easier to map wearable data into EHR systems. For instance:
- Time-stamped vitals fit into the
Observationresource. - Device details go into the
Deviceresource. - AI-generated summaries belong in the
DiagnosticReport.
SMART on FHIR apps can further streamline this process by embedding analytics directly into the clinician’s workflow. This allows providers to view trends and risk scores without needing to switch between screens.
Programs like Kaiser Permanente‘s virtual cardiac rehab, which integrates wearable data, demonstrate the potential of this approach. Their program achieved an 87% completion rate and reduced readmission rates to under 2%. By clearly documenting trends and sharing insights, care teams can work together seamlessly, building on a foundation of reliable data and consistent communication.
Validate Findings and Create Action Plans
After combining wearable data with clinical records and AI insights, the next step is to confirm the data’s accuracy and translate findings into actionable steps. This process involves clinical validation, tailored guidance, and ongoing monitoring.
Confirm Findings with Expert Consultation
Wearable data should never be the sole basis for clinical decisions. Always validate alerts and trends using medical-grade diagnostic tools. For instance, if a smartwatch detects a possible atrial fibrillation episode, confirm it with a 12-lead EKG or Holter monitor before making any treatment changes. This ensures decisions are based on reliable information, protecting both patients and providers from acting on potentially inaccurate consumer-grade data.
"If you put wearable metrics in the chart as facts, you’re implying they’re clinically reliable and relevant." – Residency Advisor
In specialized cases, such as monitoring spine health or chronic conditions, remote therapeutic programs can provide expert validation. For example, the aiSpine device tracks real-time posture deviations, but any concerning patterns should be reviewed by a specialist to differentiate clinical issues from normal variations.
Once findings are confirmed, tailor recommendations to the patient’s individual baseline.
Provide Personalized Recommendations
Craft personalized recommendations by comparing sustained deviations to a baseline established over two to four weeks of stable conditions.
Focus on trends over time rather than isolated data points. For example, if a patient’s resting heart rate is consistently elevated above their baseline for several days, investigate possible triggers like late meals, alcohol, travel, or stress. Use the DACIA Framework as a guide: collect Data, Aggregate it over relevant time periods, Contextualize it with behavioral factors, Interpret it against personal benchmarks, and define specific Actions. For instance, if aiRing data shows a consistently low heart rate recovery after exercise, consider adjusting exercise intensity or referring the patient to a cardiologist.
The "Smallest Worthwhile Change" (SWC) – roughly 30% of normal variation – can help distinguish routine fluctuations from significant changes. Shifts smaller than this threshold are likely normal, while larger ones may need further evaluation.
With personalized recommendations in place, continuous monitoring helps fine-tune treatment plans.
Track Progress and Adjust Treatment
Ongoing monitoring allows for adjustments based on real-world data. Instead of daily reviews, conduct a quick 5-minute weekly audit: examine 7-day or 30-day data summaries, identify sustained deviations from the baseline, correlate them with behavioral changes, and adjust one variable at a time.
Between 2020 and 2024, the BarKA-MS study at the Valens Rehabilitation Centre in Switzerland used Fitbit Inspire HR devices to monitor individuals with Multiple Sclerosis. By combining sensor data with weekly self-reports, the study found that 8 out of 38 participants showed measurable improvements in overcoming physical activity barriers over an 8-week period, with a 96% survey completion rate and over 97% valid wear days.
When refining treatment, set clear "red flags" that signal the need for immediate action. Examples include a resting heart rate consistently over 100 bpm, blood oxygen (SpO2) levels below 95%, or persistent joint pain. Document these thresholds in the care plan so patients know when to seek urgent medical attention.
"Health literacy in the wearable era means learning to read trends, not react to noise." – Paul Burggraf, Co-founder and Chief Science Officer, Thryve
The AIH Health App integrates data from devices like aiSpine and aiRing, making it easier to track progress and adjust plans. By focusing on trends, validating findings with clinical tools, and refining treatments based on real-world results, wearable data becomes a key resource for personalized care.
Conclusion
Making sense of wearable health data requires more than just gathering numbers – it demands a systematic process that turns raw sensor outputs into meaningful clinical insights. Without proper validation and context, even the most advanced devices can lead to misinterpretation. As Dr. Matthew Tomey from Mount Sinai Fuster Heart Hospital aptly puts it:
"As with any innovation, these tools bring both promise and perils. They are a source of more data; the devil lies in how we use the data, and the context in which we interpret them".
The checklist framework described earlier helps healthcare providers move from simply collecting data to actively managing patient health. Establishing a 2- to 4-week baseline and identifying true trends rather than daily variations unlocks the full potential of continuous monitoring.
Devices like AIH LLC‘s aiSpine and aiRing, when paired with the AIH Health App, take this a step further. These tools don’t just measure – they analyze. Using advanced algorithms, they identify patterns, provide real-time feedback, and enable early interventions. For example, AI models can alert clinicians to early signs of fluid overload in heart failure patients up to 48–72 hours before symptoms worsen.
This evolution from passive tracking to active clinical decision-making is reshaping healthcare. When wearable data is combined with clinical context and enhanced by AI-driven analytics, it becomes a cornerstone of personalized medicine. However, the human element remains critical – AI excels at identifying patterns and triaging data, but the final decisions must rest with clinicians who can apply their comprehensive judgment to each unique case.
FAQs
How do I know my wearable data is accurate enough to trust?
To determine if the data from your wearable device is trustworthy, focus on its consistency, how well it detects changes, and whether it aligns with clinical benchmarks. Treat the information as a helpful guide rather than an exact medical measurement. Be aware of the device’s accuracy limitations, confirm it has been validated for tracking your specific health metrics, and consult a healthcare professional to interpret the results. This way, you can use the data responsibly and with confidence.
What baseline period should I collect before acting on trends?
Before making any decisions, it’s important to gather weekly and monthly health data trends to establish a baseline. This approach helps you differentiate between typical fluctuations and possible issues, leading to a more accurate understanding of wearable health data.
When should wearable alerts be confirmed with clinical tests?
When wearable devices flag persistent or notable abnormalities, it’s important to verify these findings through clinical tests. This is especially true if the data suggests a possible health concern that warrants further medical investigation. Clinical testing helps ensure the accuracy of the wearable’s data and provides the necessary foundation for appropriate medical care.